The GTM Maturity Framework
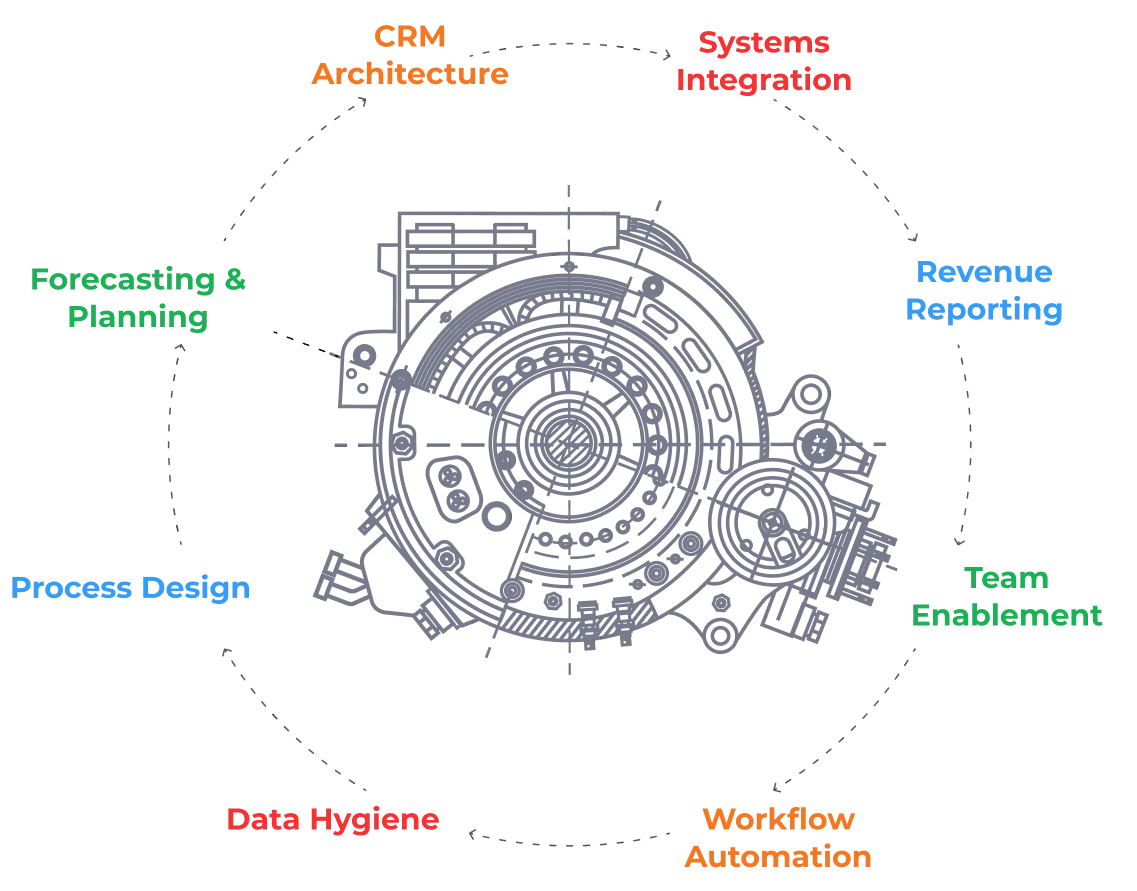
You have the horsepower. Do you have the map?
You've invested in the CRM, the tools, and the team. The GTM Maturity Framework shows what that engine can actually tell you today, what it can't, and what it takes to go from guessing to knowing.
Why it matters
Your data should be your best asset. It might be your most expensive liability.
Your revenue stack is a luxury car with every upgrade. Massive engine, custom navigation, the works. But if nobody trusts the numbers, it sits in the garage. Forecast calls turn into debates about whose spreadsheet is right. Pipeline moves and nobody can say why. Churn shows up as a surprise at renewal.
That gap between having data and acting on it shows up on your P&L. You have the horsepower. What's missing is the map.
The average organization runs 897 applications. Only 29% of them are integrated.
The GTM Maturity Framework measures exactly where your revenue engine sits today, and what it takes to reach the next level.
See what each level lets you tell your board
What each level lets you tell your board · tap one to explore
Truth 1
You can't buy your way up a level.
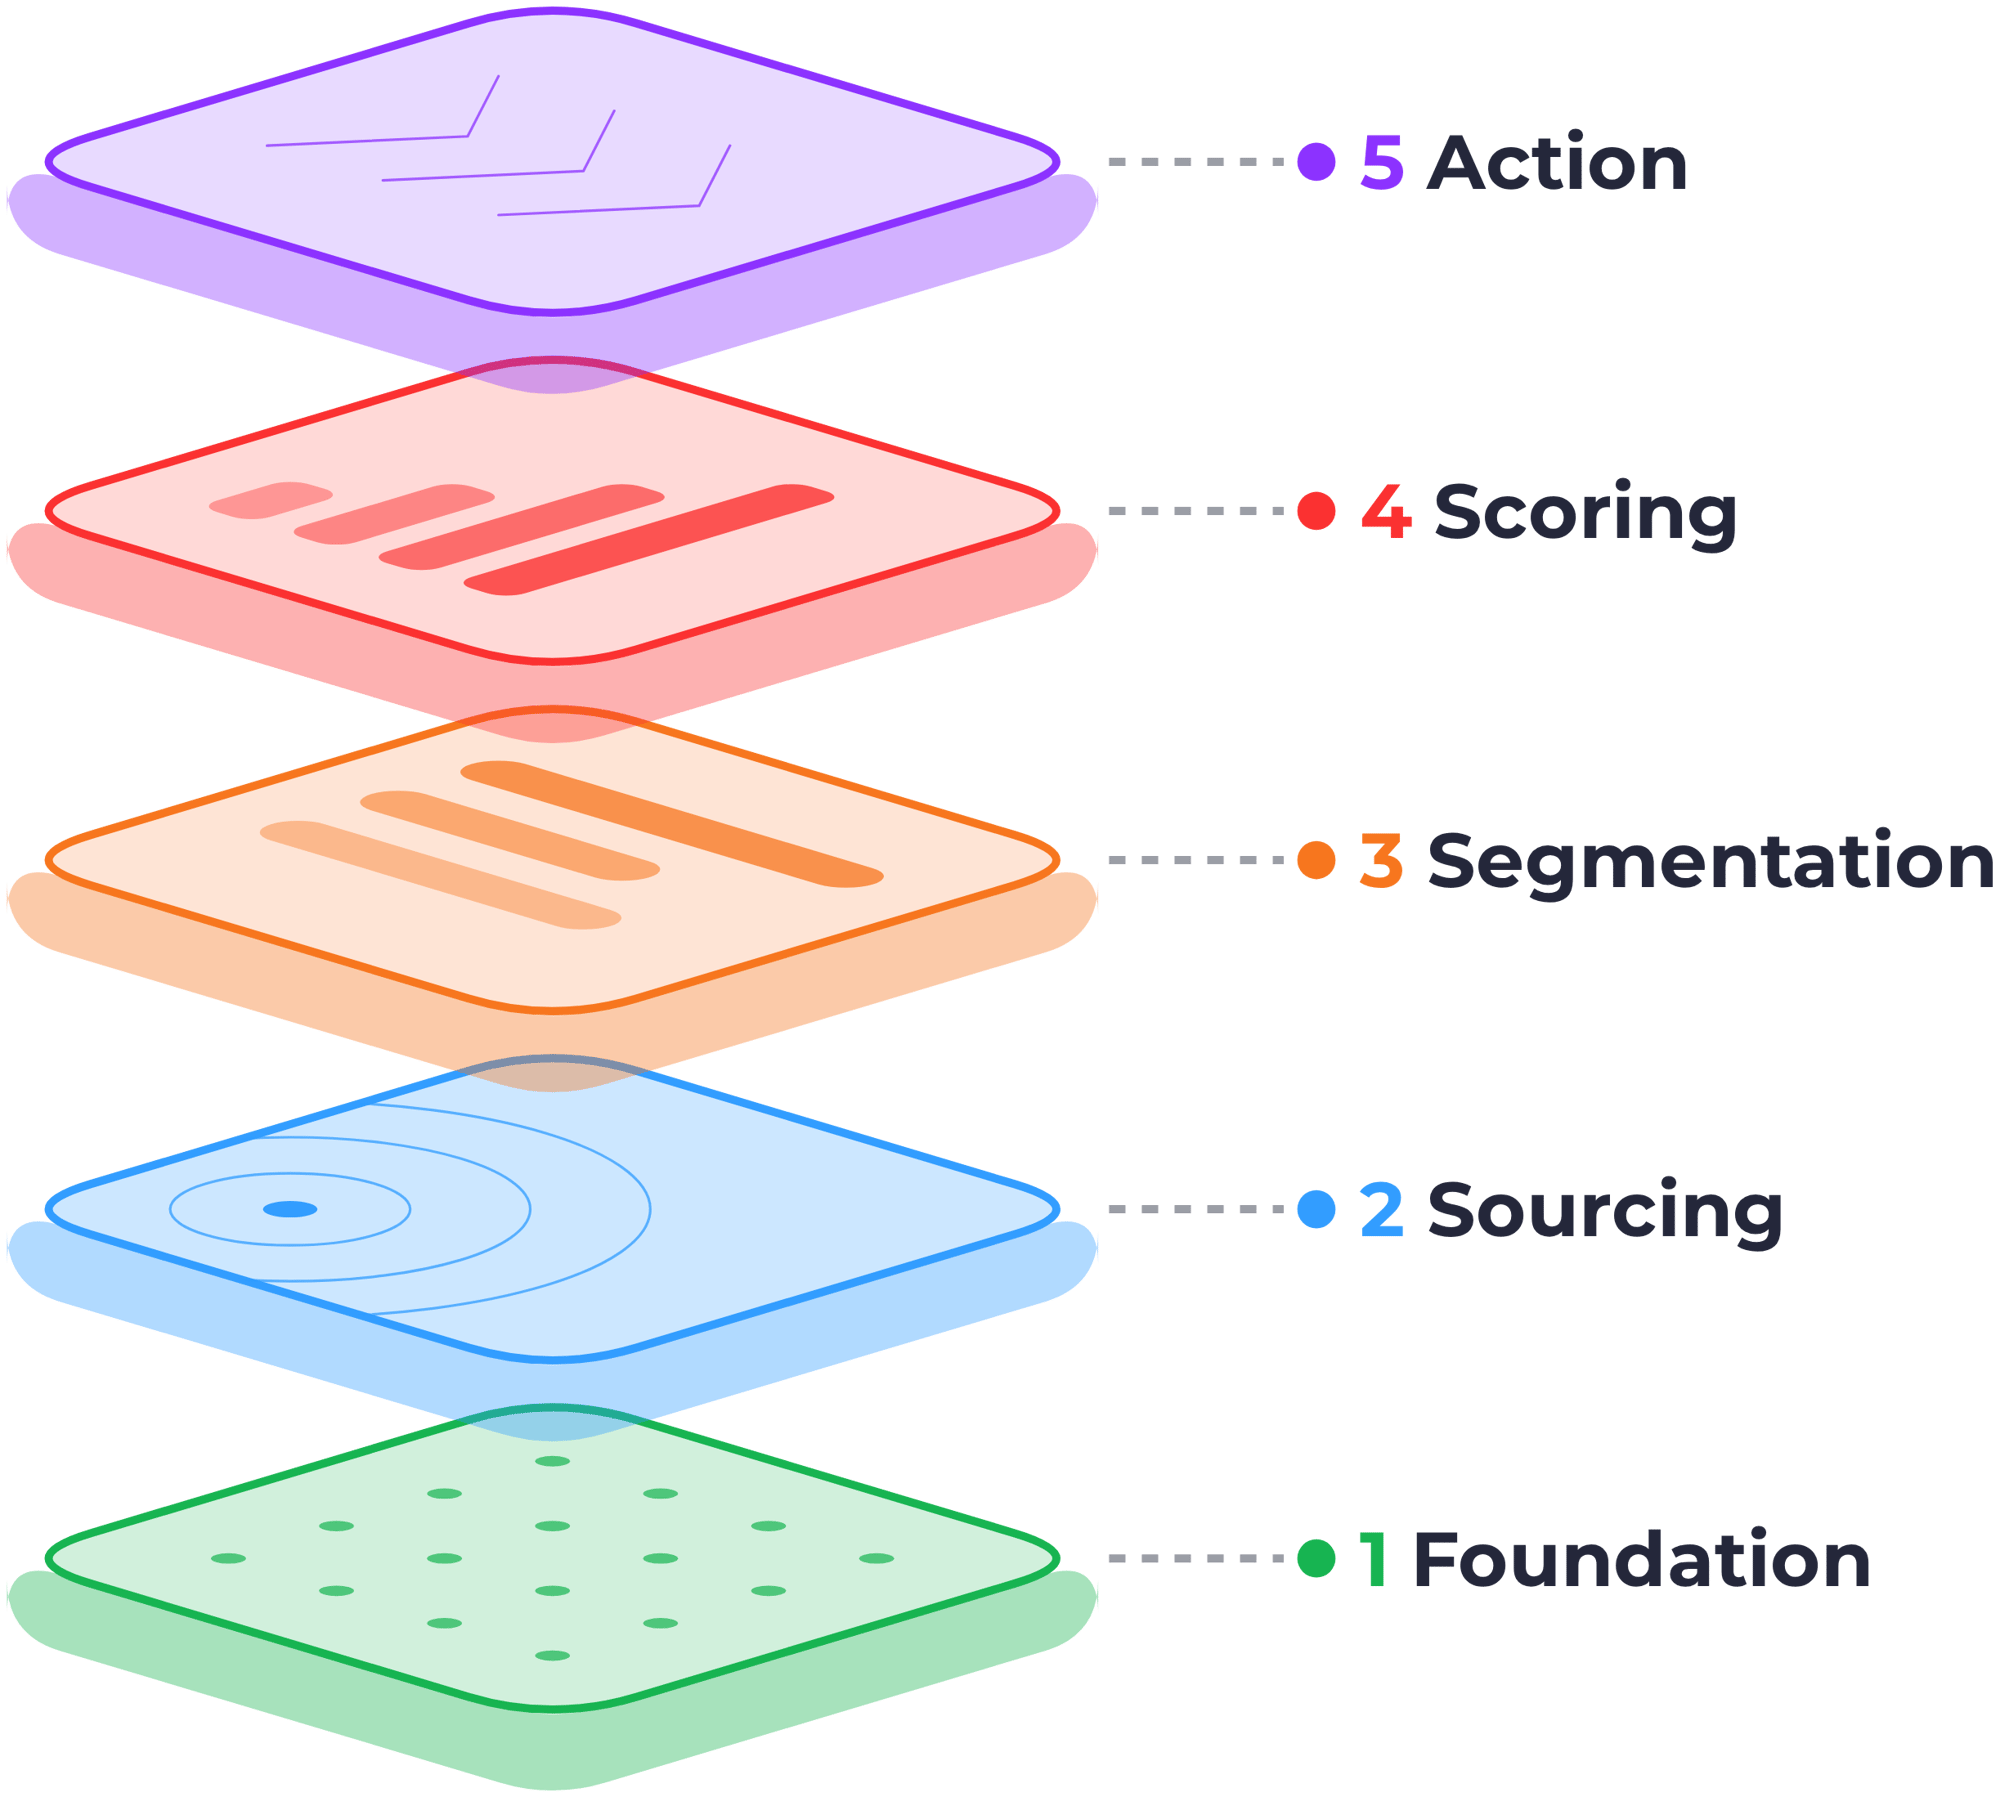
New tools don't skip steps. Every level depends on the one beneath it, and skipping one is how expensive tech stacks end up in the garage.
Truth 2
Your level sets your ceiling.
Your forecast can't be more reliable than the level it's built on. Neither can your board deck.
Truth 3
Each level changes the question you can answer.
From "Which number is right?" all the way to "What will we close next quarter, and what will it cost us?"
Level 0 → Level 1 · Where most engines stall
Would your teams pass the Same-Language Test?
When Marketing, Sales, and Finance define the same metric differently, your board deck is built on numbers nobody can defend. Flip each metric from failing to passing to see what changes.
Clarity is kindness. Misaligned teams usually aren't a people problem. They're a definition problem, and that's fixable: one documented definition per metric, enforced in your data model.
The framework
Six levels. One order.
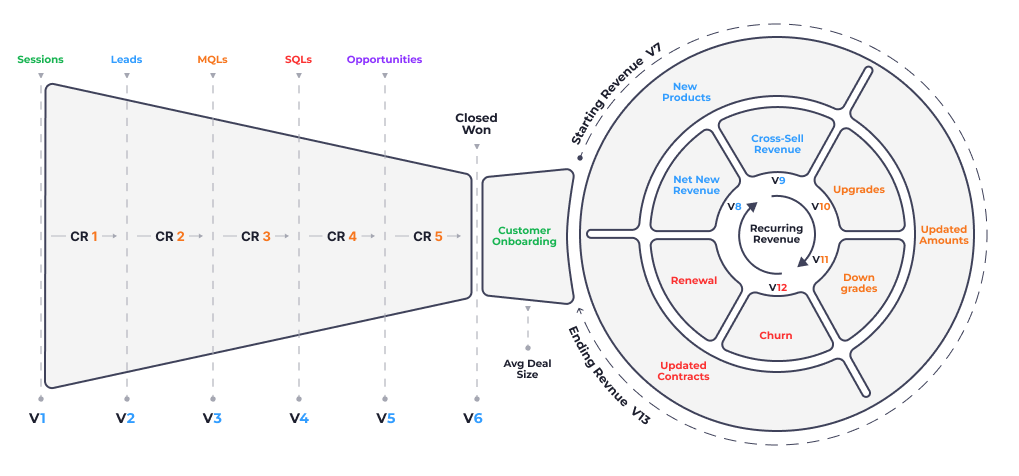
Pick a level to see what leadership can see there, what it costs to stay, and what moves you up. The diagram is our Revenue Performance Model™ (RPM): the acquisition funnel from Sessions to Closed Won, then the recurring revenue flywheel of renewals, expansion, and churn.
Level 2 → Level 3
Same number. Completely different conversation.
Level 2 tells you you're going to miss. Level 3 tells you why, while there's still time to do something about it. Here's the difference on one metric: a 25% close rate.
Will we hit the number?
Turn the target into a pipeline requirement nobody can argue with.
opportunities need to be in the pipeline when the quarter starts.
Why is it 25%?
Split the same metric by who, what, where, and when. The fix becomes obvious.
Level 4 · Compounding
Your cheapest growth is the revenue you already have.
Predictability is the starting line, not the finish. Model your existing customer base below and see what it's worth in three years with zero new logos. Then ask yourself: could you report these four numbers today?
The compounding engine
12-month viewThe diagnostic
Where does your engine sit?
Two minutes, nine questions at most. If something is only partly true for your team, choose "Not yet." Each level builds on the one before it, so the diagnostic ends at your first "Not yet" and shows you the level you've fully reached.
Your next level
You know where you are. Let’s get you to the next level.
Every level changes what your leadership team can see and act on. RevPartners builds the operations behind each one, from the foundational data model to full lead-to-cash visibility. Bring your diagnostic result, and we’ll map the route to your next level and help you drive it.