
Clarity for every GTM decision.
RevOps reporting software to see where your business is winning, where it's falling behind, and whether you're on track to reach your goals.
What is BLUF?
A real-time GTM scorecard
BLUF continuously compares live CRM performance against your goals, giving every GTM team an instant answer before small problems become missed quarters.
Better decisions start with better visibility.
Your time is valuable. Don't spend it inputting data by hand — risking errors — when you could be working on your goals.
-
1
Static reporting slows down GTM teams.
By the time a spreadsheet reaches leadership, the business has already changed. -
2
BLUF gives answers instantly
BLUF connects directly to your CRM, automatically updating every metric, goal, and dashboard so your team always has the same answer—and knows exactly where to focus next.
Why GTM Teams Use BLUF
Dashboards show the past. BLUF helps you improve the future.
Most teams waste hours digging through dozens of reports or filling in manual spreadsheets to answer a single question: Are we on track?
BLUF gives you that answer in seconds.
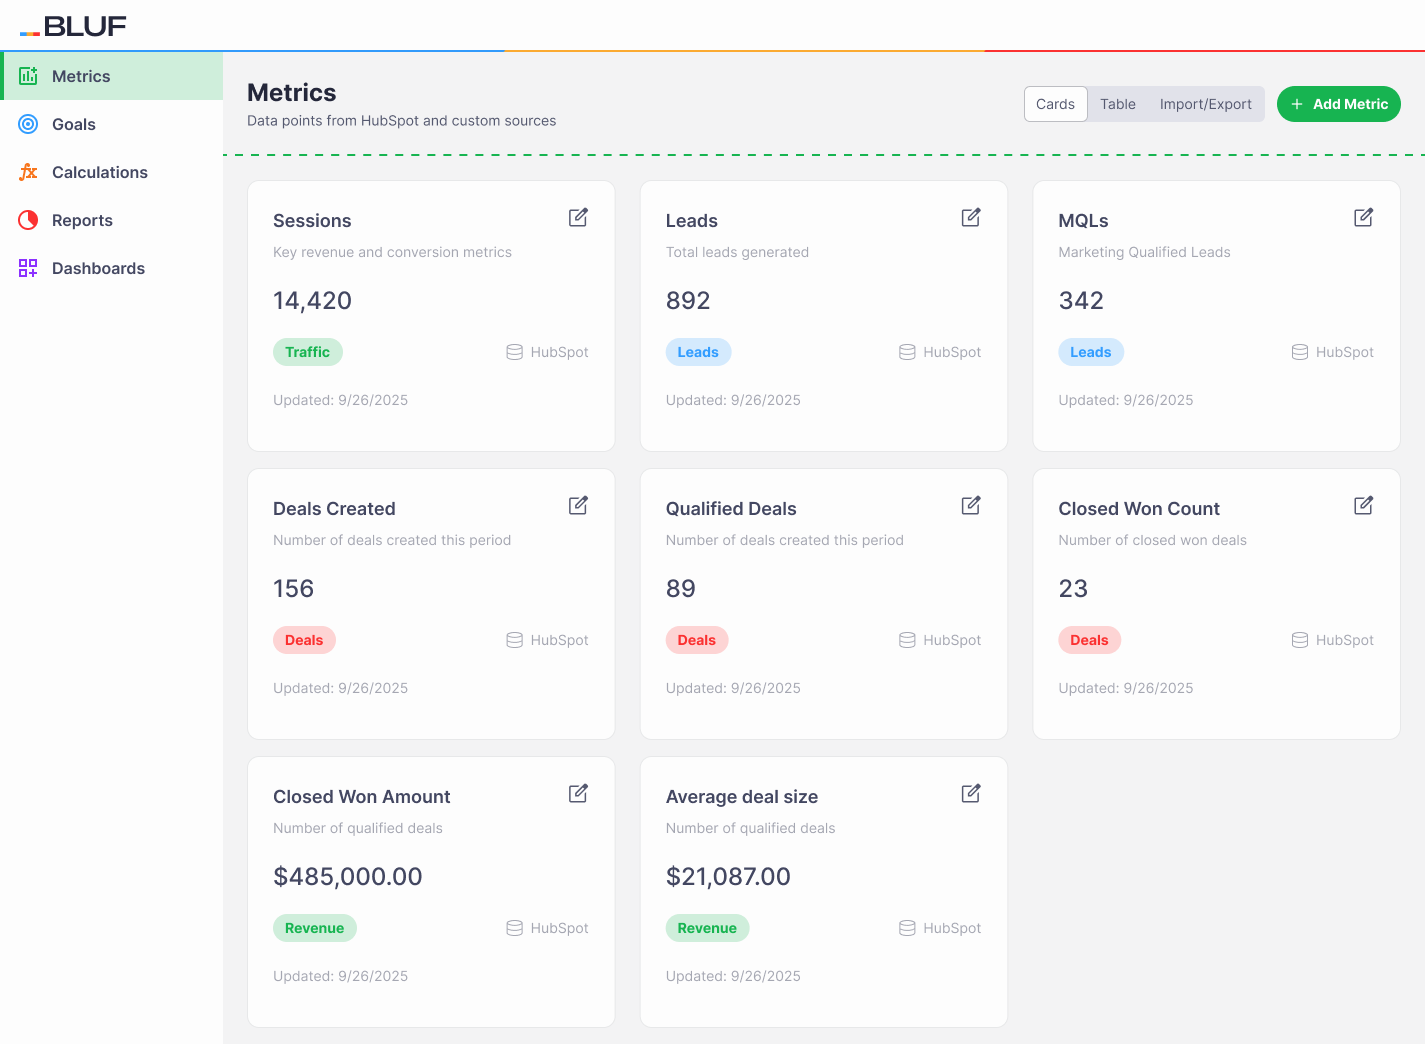
Metrics
Build one source of truth for every KPI.
Establish volume and conversion metrics to measure that KPIs that matter to your business.

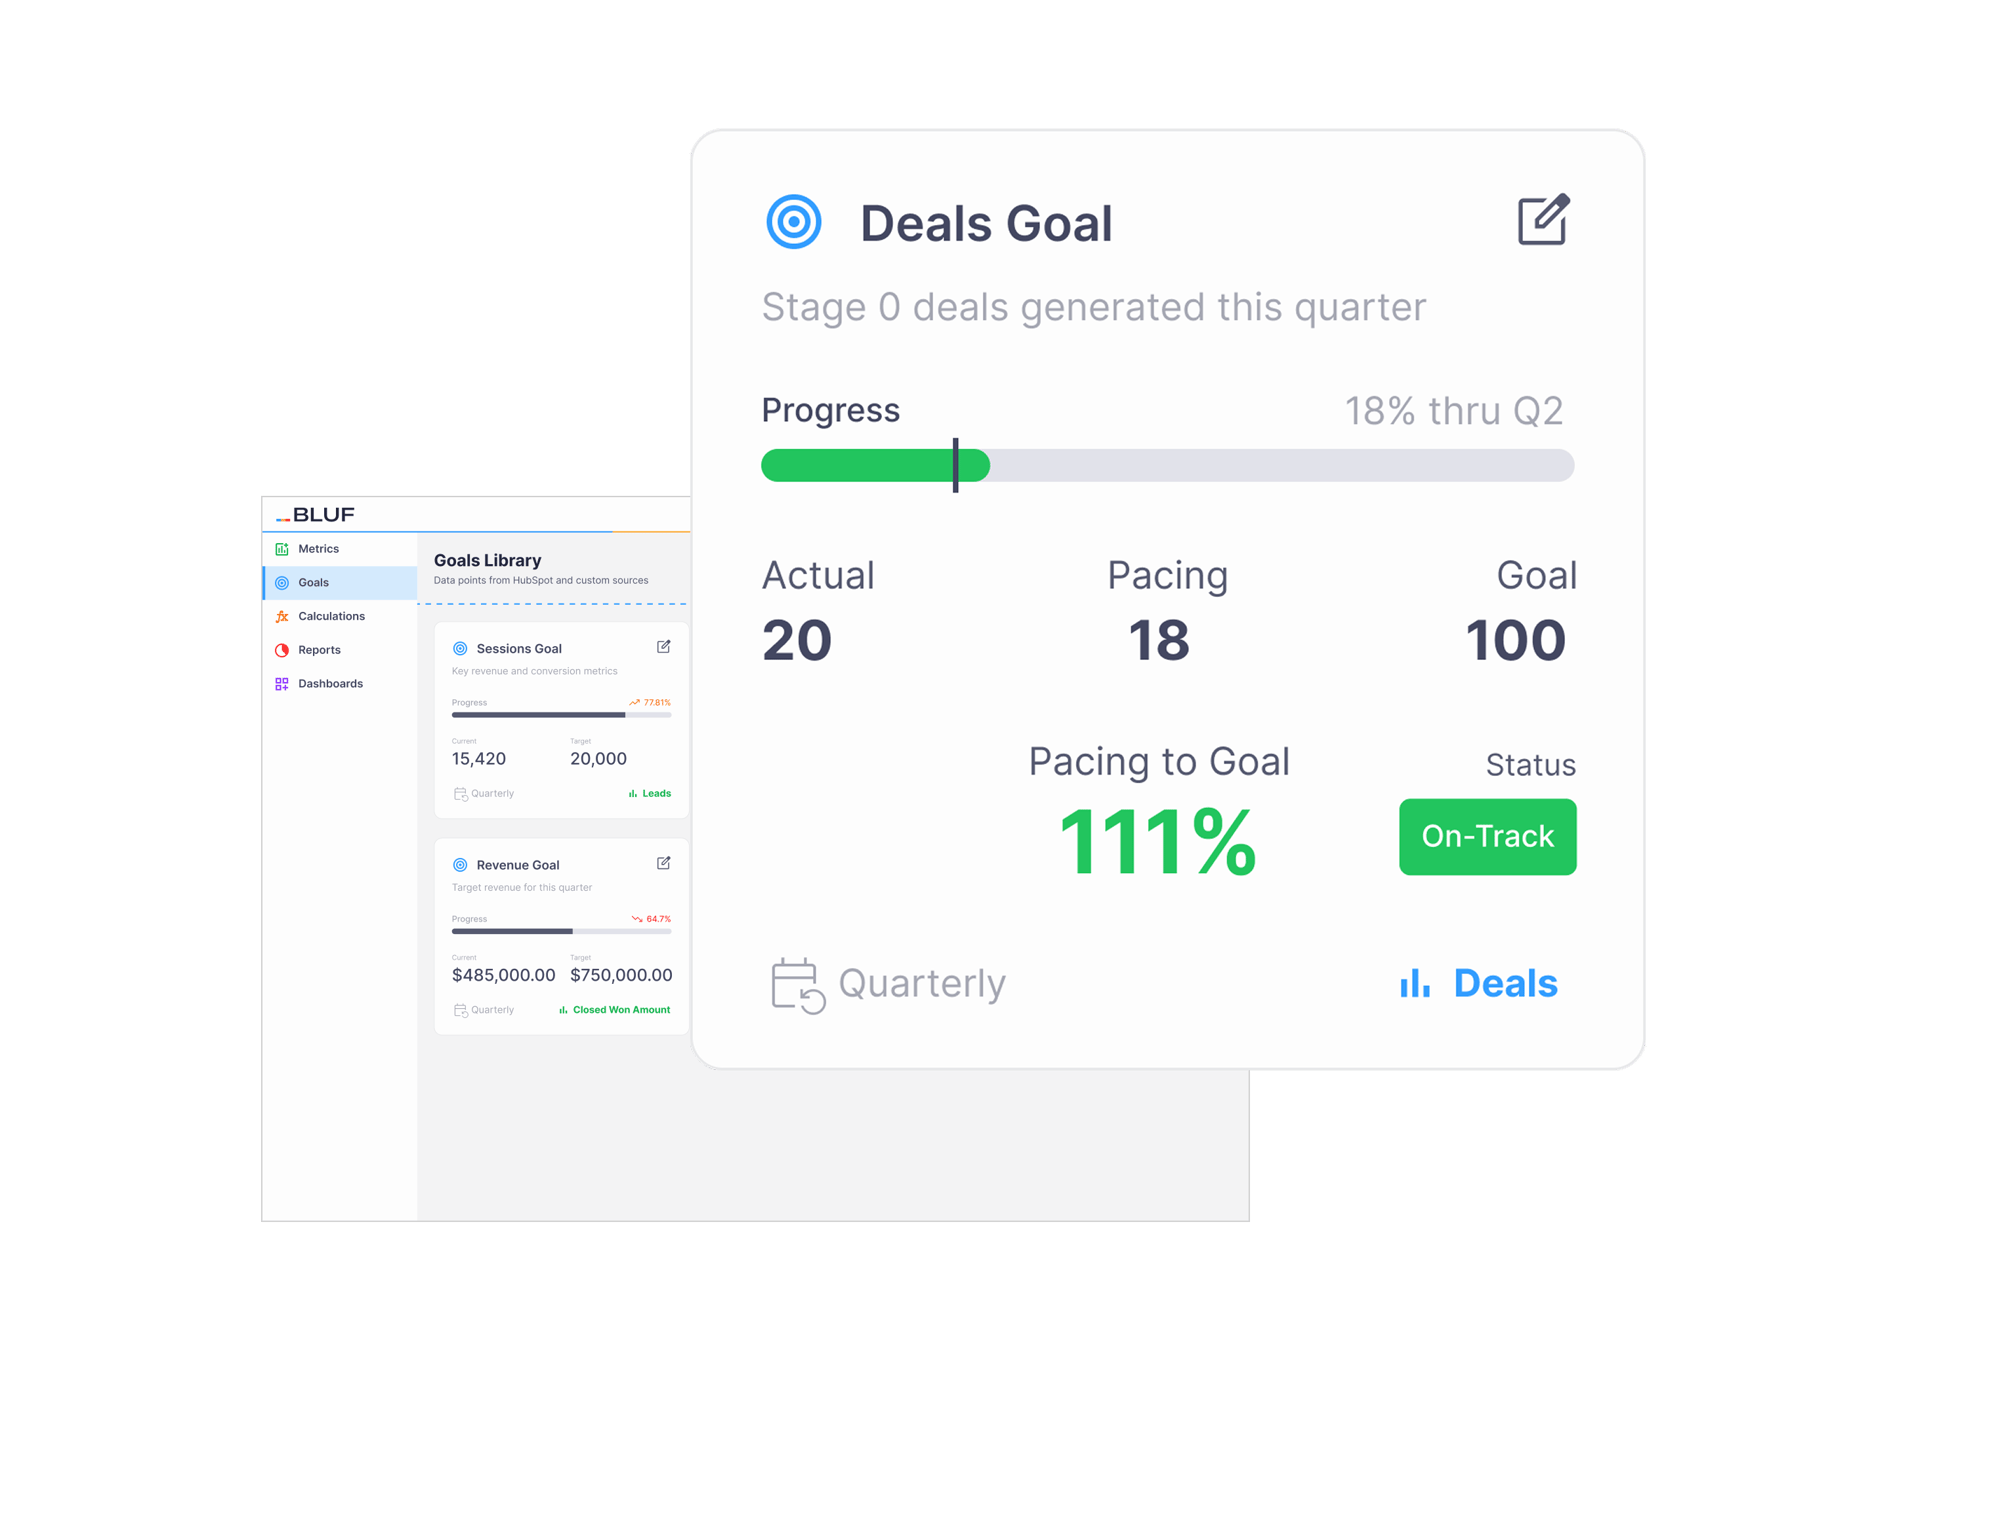
Goals
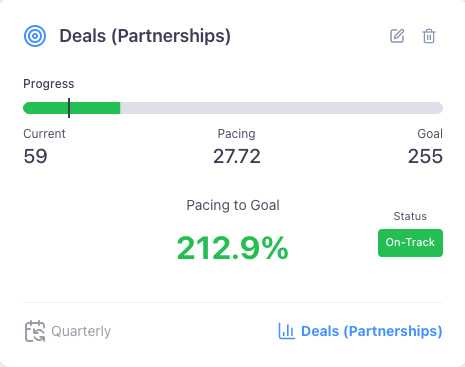
Know if you're on pace—not just where you finish.
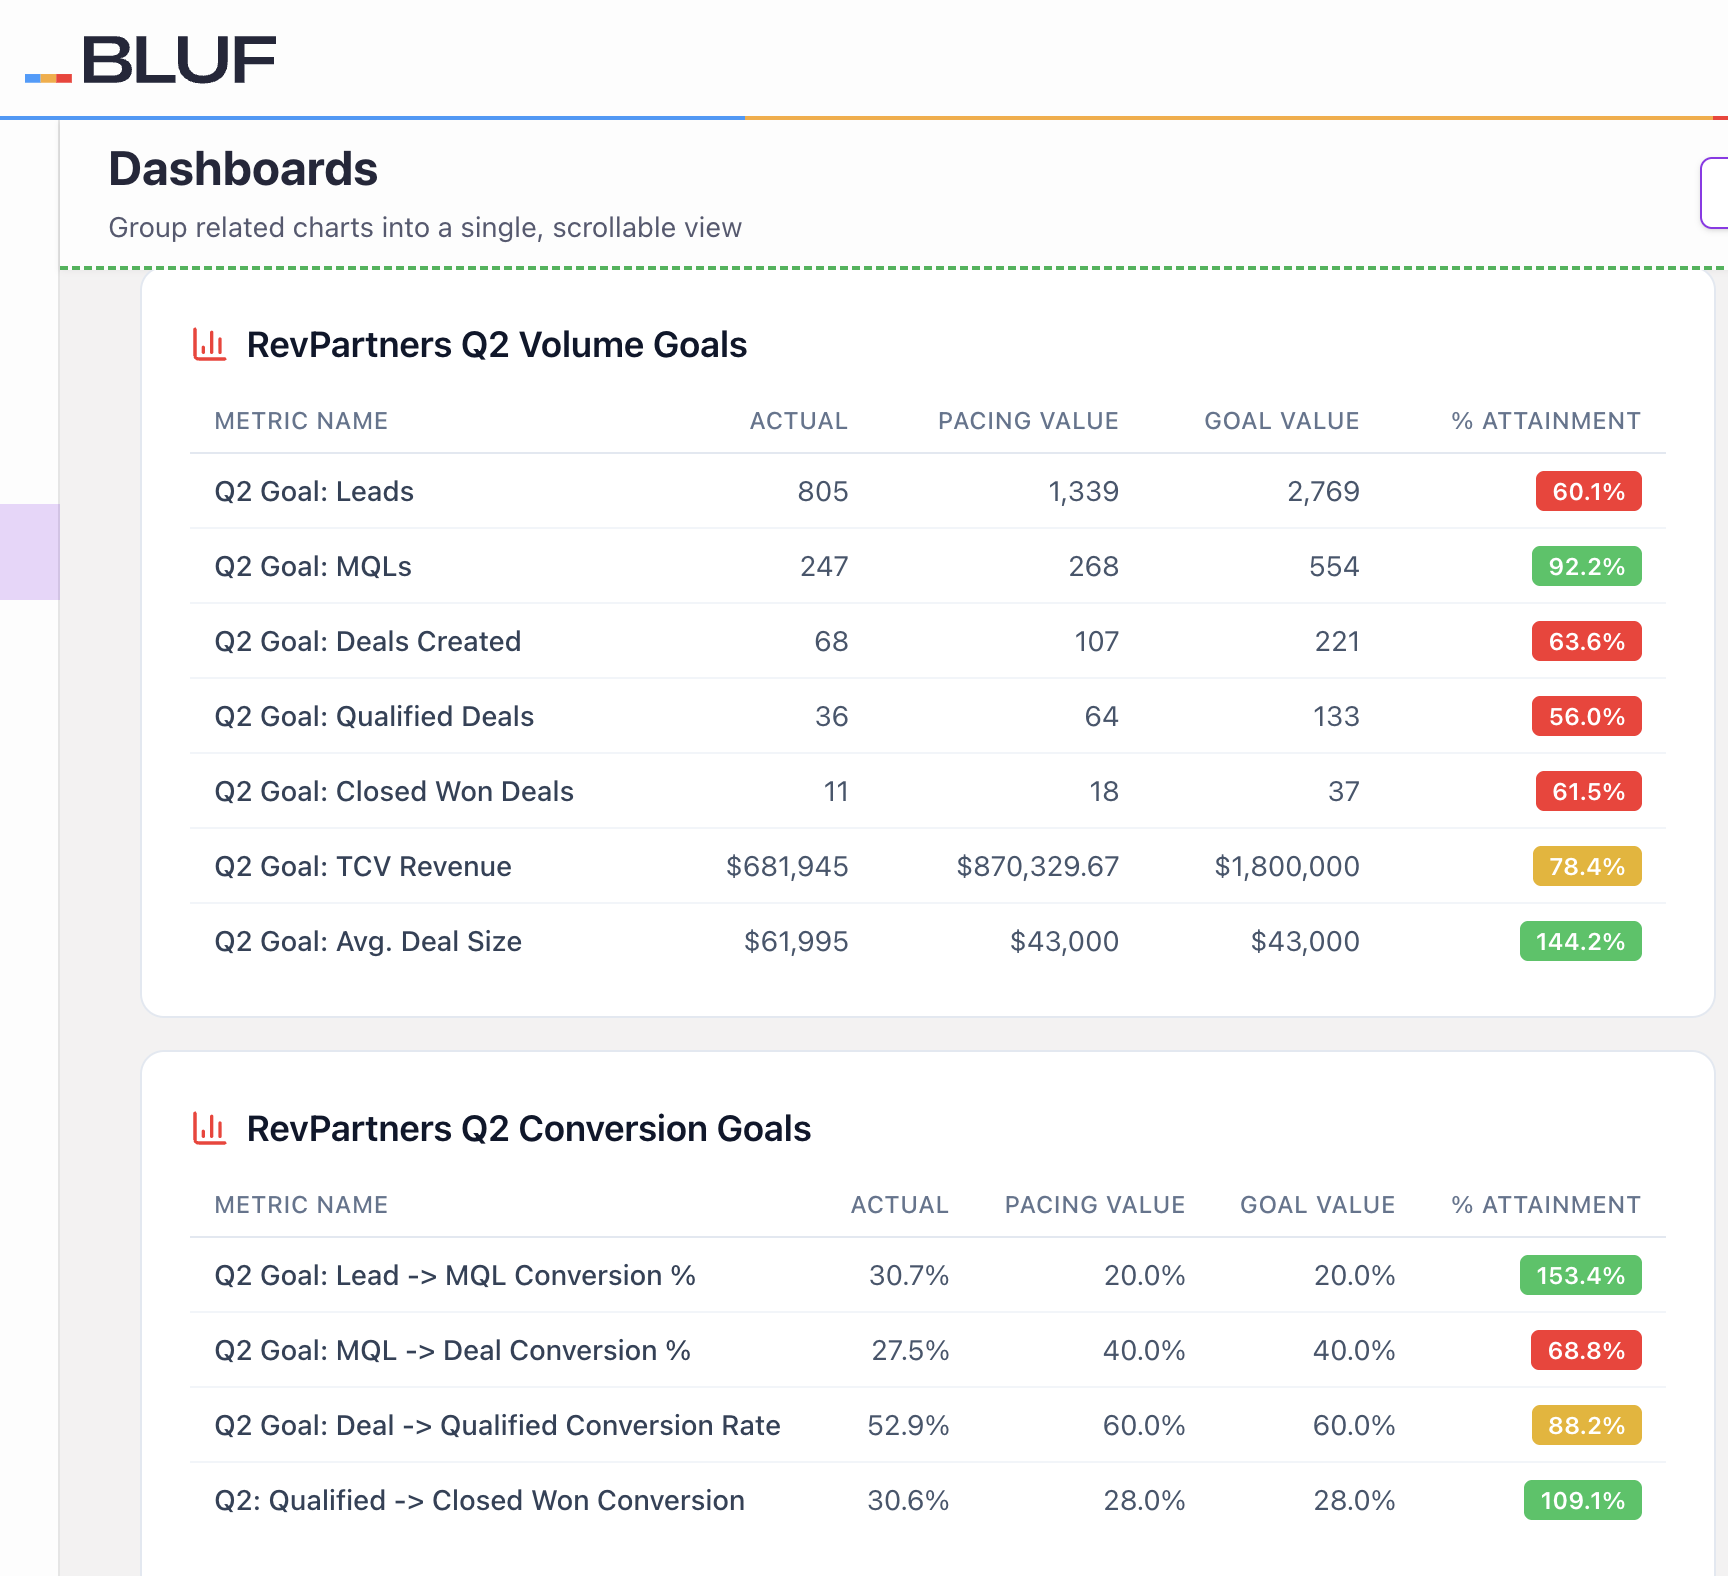
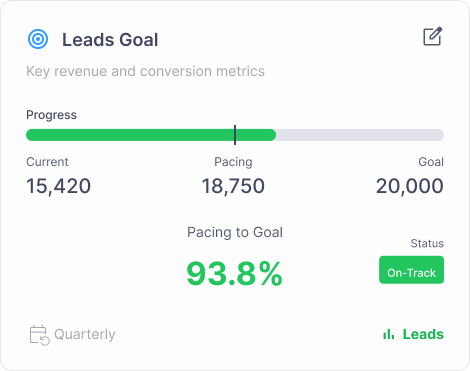
BLUF continuously compares actual performance against your targets, showing whether every goal is On Track, At Risk, or Off Track based on where you should be today.

Calculations
Turn disconnected metrics into meaningful business insights.
Combine data across HubSpot objects to measure conversion rates, average deal size, campaign ROI, revenue efficiency, pipeline velocity, and the KPIs executives actually use to run the business.

Charts
Surface what needs attention first.
BLUF visualizes performance using gauges, pacing indicators, trend charts, and scorecards designed specifically for revenue teams—making it easy to spot problems, celebrate wins, and prioritize action.

Dashboards
One dashboard. Complete GTM visibility.
Bring Marketing, Sales, Customer Success, and Revenue metrics together in one operational workspace.
Customize dashboards for every team while keeping everyone aligned around the same definitions, goals, and performance metrics.


The Framework behind Bluf
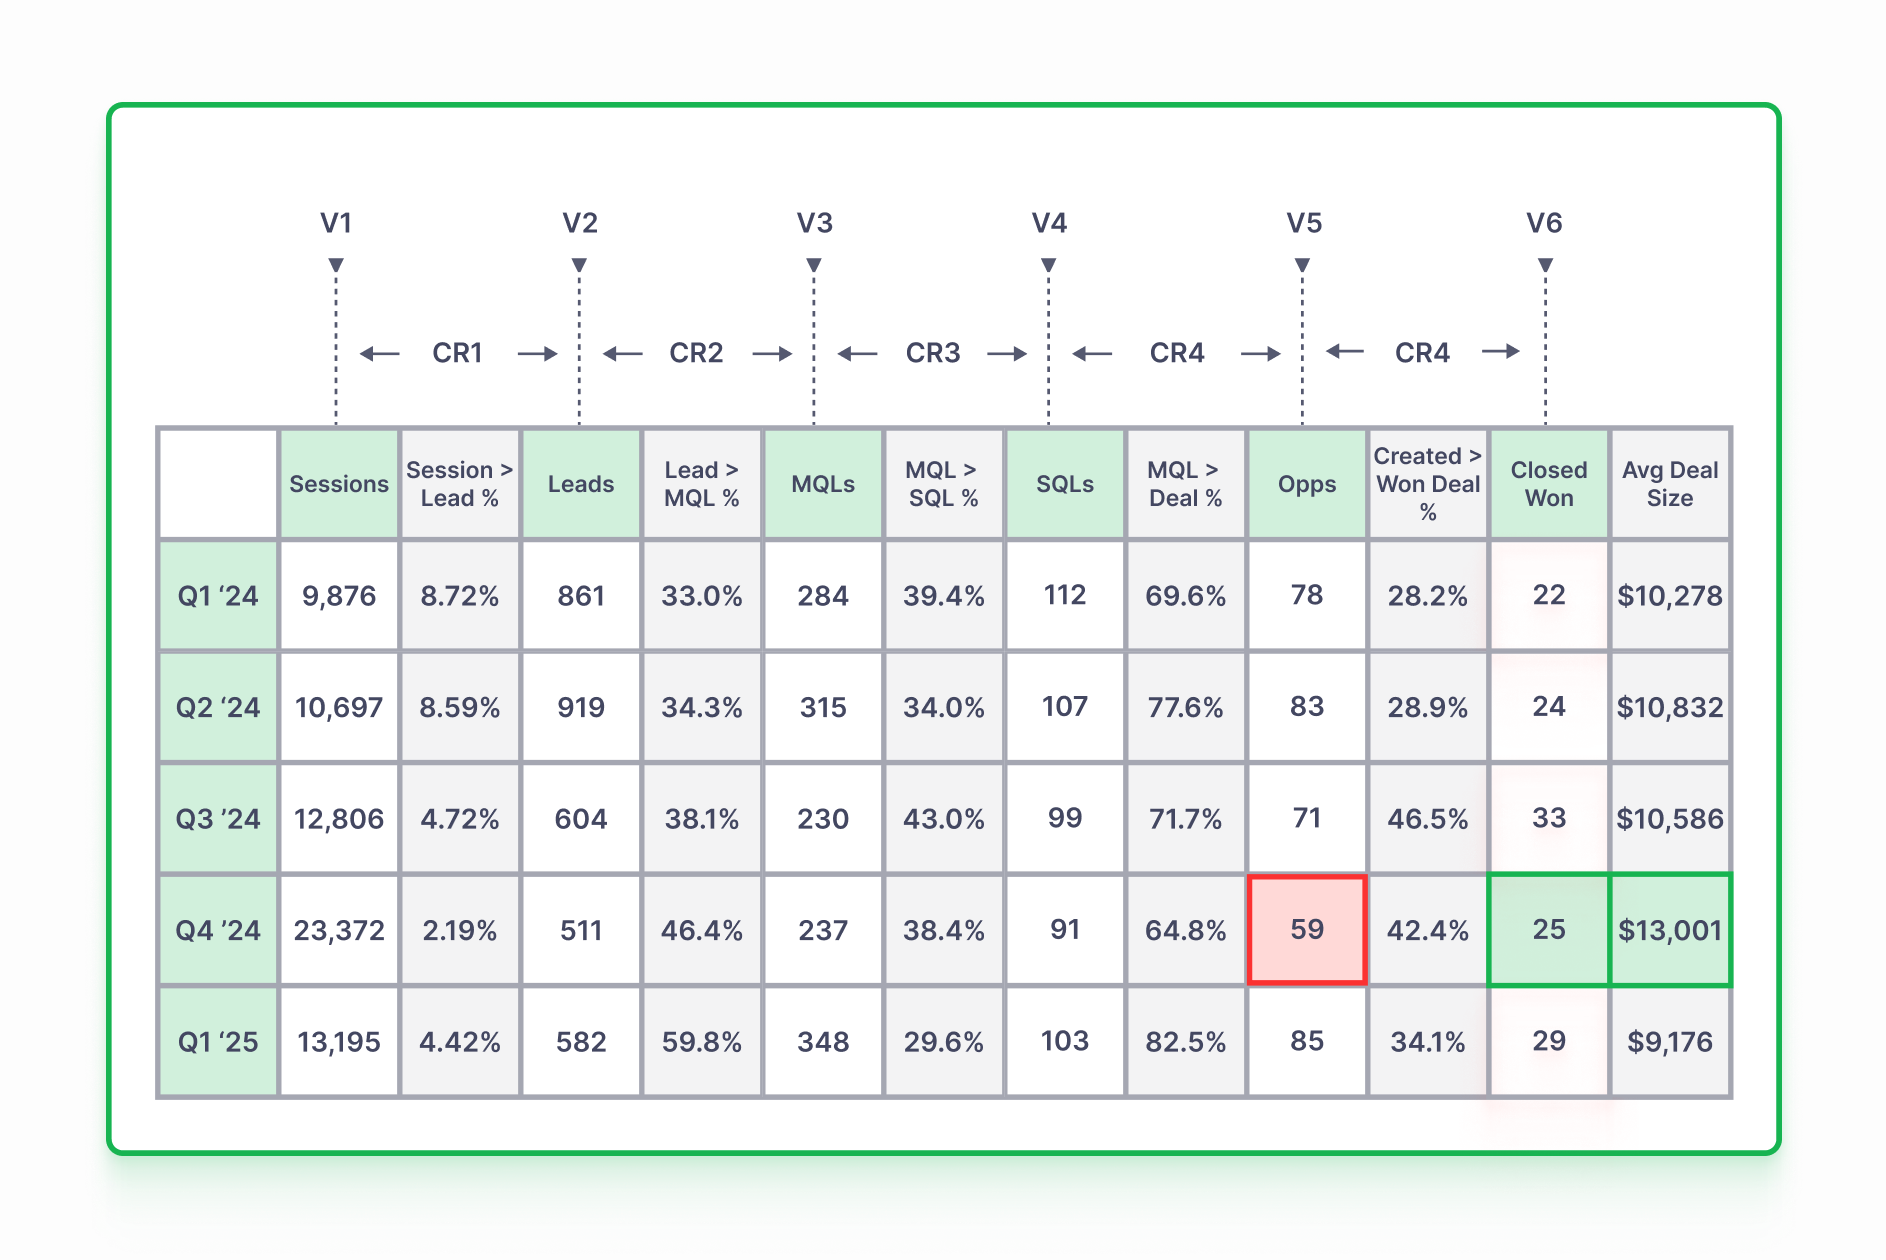
Every metric tells part of the story. RPM connects them.
BLUF is built on the Revenue Performance Model™, the operational framework that connects every stage of your customer journey—from first touch to closed revenue. Instead of isolated reports, you see how marketing, sales, and customer success work together to drive growth.

See your entire revenue engine from first touch to closed won.
Why choose BLUF?
More Demand, Less Budget
You are being asked to do more with less full-time employees. In the past, you could get away with high-level data. Today, you don't have the luxury of getting a single quarter wrong. BLUF shows you exactly where you're at and where you're trending on one screen.

Confused, Decentralized Reports
Spreadsheets are customizable and inexpensive. Multiple reports show drill down information and extra detail. But when your leadership team needs to know whether you're on target or not, you need answers that you can trust immediately.
.png?width=1472&height=800&name=pipe%20template%20(1).png)
BLUF Connects the Dots
If something isn't performing, you need to know why in 3 seconds; and you need to know how to course correct. BLUF bridges the gap between your strategic and daily execution. It's the direct output of the Revenue Performance Model we use to guide your growth.

Stop managing reports. Start managing performance.
BLUF replaces fragmented reporting with a shared operating view that gives every GTM team the visibility to make faster, more confident decisions.
Before BLUF
- Weekly spreadsheet exports
- Conflicting data
- Siloed team metrics & goals
- Reactive decision making
After BLUF
- One operating view
- Shared GTM metrics
- Live pacing to goals
- Faster, more confident decisions
BLUF FAQs
What is BLUF?
BLUF stands for Bottom Line Up Front. It’s a core philosophy embedded in our company culture, and we built this software to bring that exact same directness to your reporting.
Instead of forcing you to hunt through dozens of cluttered dashboards, BLUF strips away the noise to show you precisely how your primary revenue metrics are pacing against your goals in real time.
What are the requirements for using BLUF?
You will need to be using HubSpot as a CRM and you will need to be comfortable allowing our team access to that instance and any additional reporting tools you use. We use your own metrics to build out BLUF, so we'll need access to those numbers.
Why do I need to have HubSpot to use BLUF?
While we are actively building out integrations for other major CRMs down the road, BLUF currently integrates only with HubSpot.
Can I purchase BLUF before requesting a demo?
Absolutely! We have two purchase paths available. If you'd like to see a full demo to see the software in action and purchase through a discussion with our team, you're more than welcome to! But if you're enthusiastic about diving directly into BLUF, you can check out on your own and our team will set up onboarding right away.
What does onboarding look like?
You call the shots when it comes to onboarding. If you purchase directly, you get instant access to our self-service training video playbook so you can build what you want, how you want, right away. Prefer a guiding hand? You can also jump on a live strategy call with a BLUF expert to map your metrics and build out your custom dashboards together.
How much does BLUF cost?
$199 per month for complete access to the software, setup, and hosting.
I already have HubSpot reporting. Why do I need BLUF?
Standard CRM reporting is great for looking backward at past performance, but it fails when you need to see real-time pacing against a dynamic goal. HubSpot will show you your progress toward a goal at the exact end of a quarter; BLUF constantly prorates your goals daily, telling you today if you are pacing to win, lose, or stall while you still have time to fix it.
Additionally, BLUF easily handles complex, multi-object formulas and custom calculations that are difficult to build directly inside HubSpot.
