Data Hygiene
Standardizing definitions across marketing, sales, customer success, and finance.
 Run The R.E.D.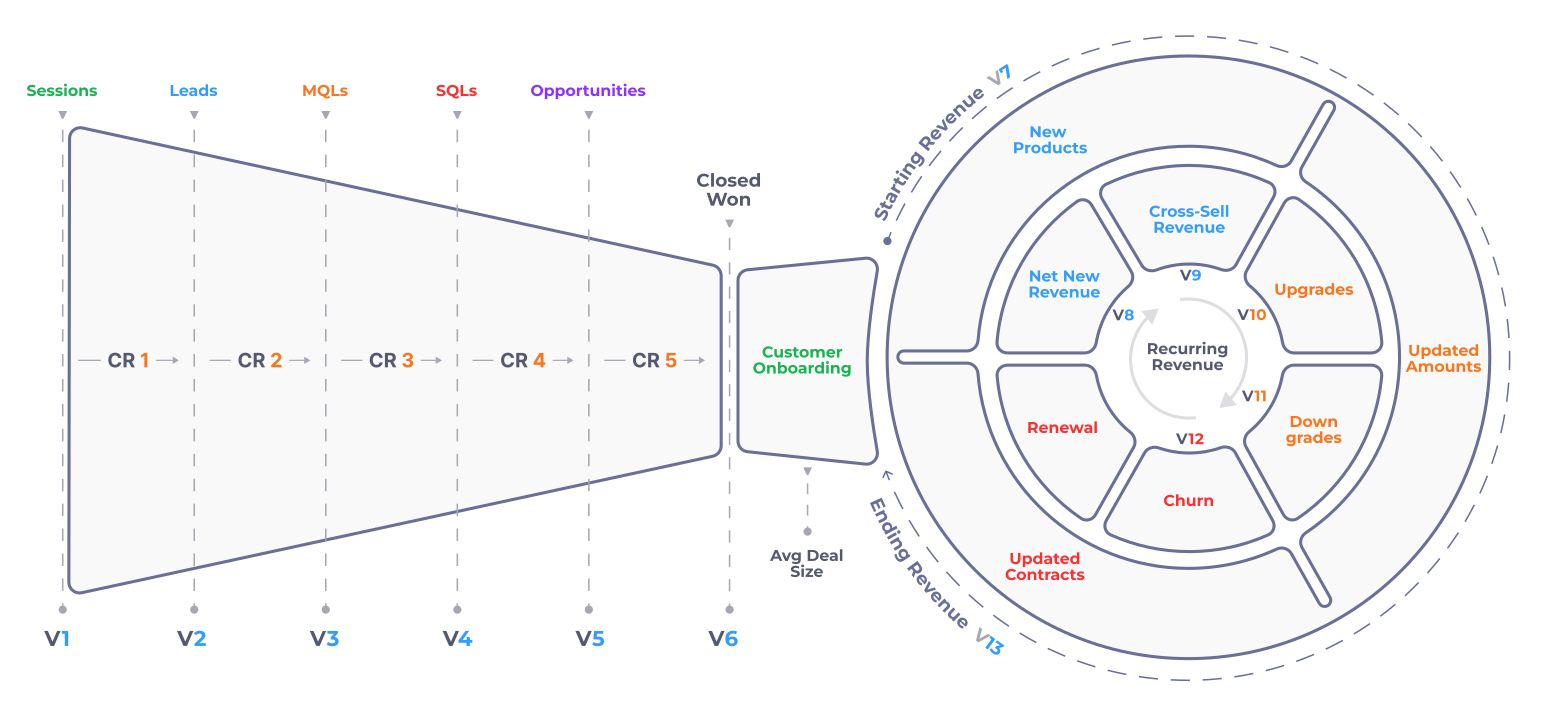
Stop measuring the promise. Start engineering the revenue.
The Bottom Line Upfront (BLUF)
Why? Because they are using a B2C transaction playbook to run a recurring subscription business.
The Recurring RPM connects acquisition, activation, retention, and expansion in one measurable model — so leaders can see not only what revenue was sold, but when it became live, where it is leaking, and what will drive growth next.
The Status Quo
A deal hits Closed-Won.
And Finance sits quietly, waiting to see if the proverbial check clears.
Closed ARR vs. Live MRR
A deal object in your CRM is an intention. It’s a promise of money to come. But banks don't accept promises. When you run reporting strictly on closed deals, you get trapped in the dead space between two completely different realities.
The Promise
When onboarding takes 60 — or more — days, or DSO (days sales outstanding) keeps climbing, your Closed ARR data is lying to your board.
To scale a recurring revenue business, you must stop measuring transaction volume and start engineering revenue velocity.
The Need For Good RevOps
A lot of SaaS companies think they have a reporting problem. What they actually have is a data governance and hygiene problem.
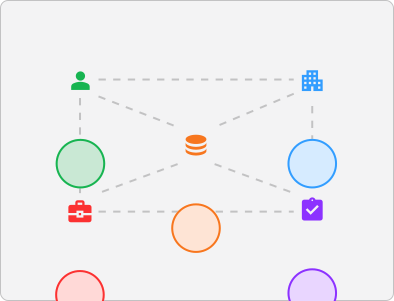
When sales reps bypass required fields, marketing tools create duplicate contacts, and billing platforms fail to sync with your CRM objects (and that’s not even touching on the chaos-creators that are import and upload practices), you can’t even begin to visualize your data. Let alone report with any clarity.
Trying to run any data model on bad data is like putting rocket fuel into a car with a cracked engine block and no tires.
This is why Revenue Operations (RevOps) isn't just a tactical support role — it’s a strategic growth driver.The Foundation
It starts with a clean, structured data foundation owned by a dedicated RevOps function.
Standardizing definitions across marketing, sales, customer success, and finance.
Ensuring all systems work together to show KPIs across every department and function for ultimate clarity.
Structuring objects so data flows seamlessly across the entire lead-to-cash lifecycle.
Enforcing the daily CRM behaviors that keep data clean and trustworthy.
Create full visibility from lead to cash.
The Revenue Performance Model™
Once your data layer is clean, you need an operational framework to measure it. And that’s what the Revenue Performance Model™ (RPM) was designed to do.
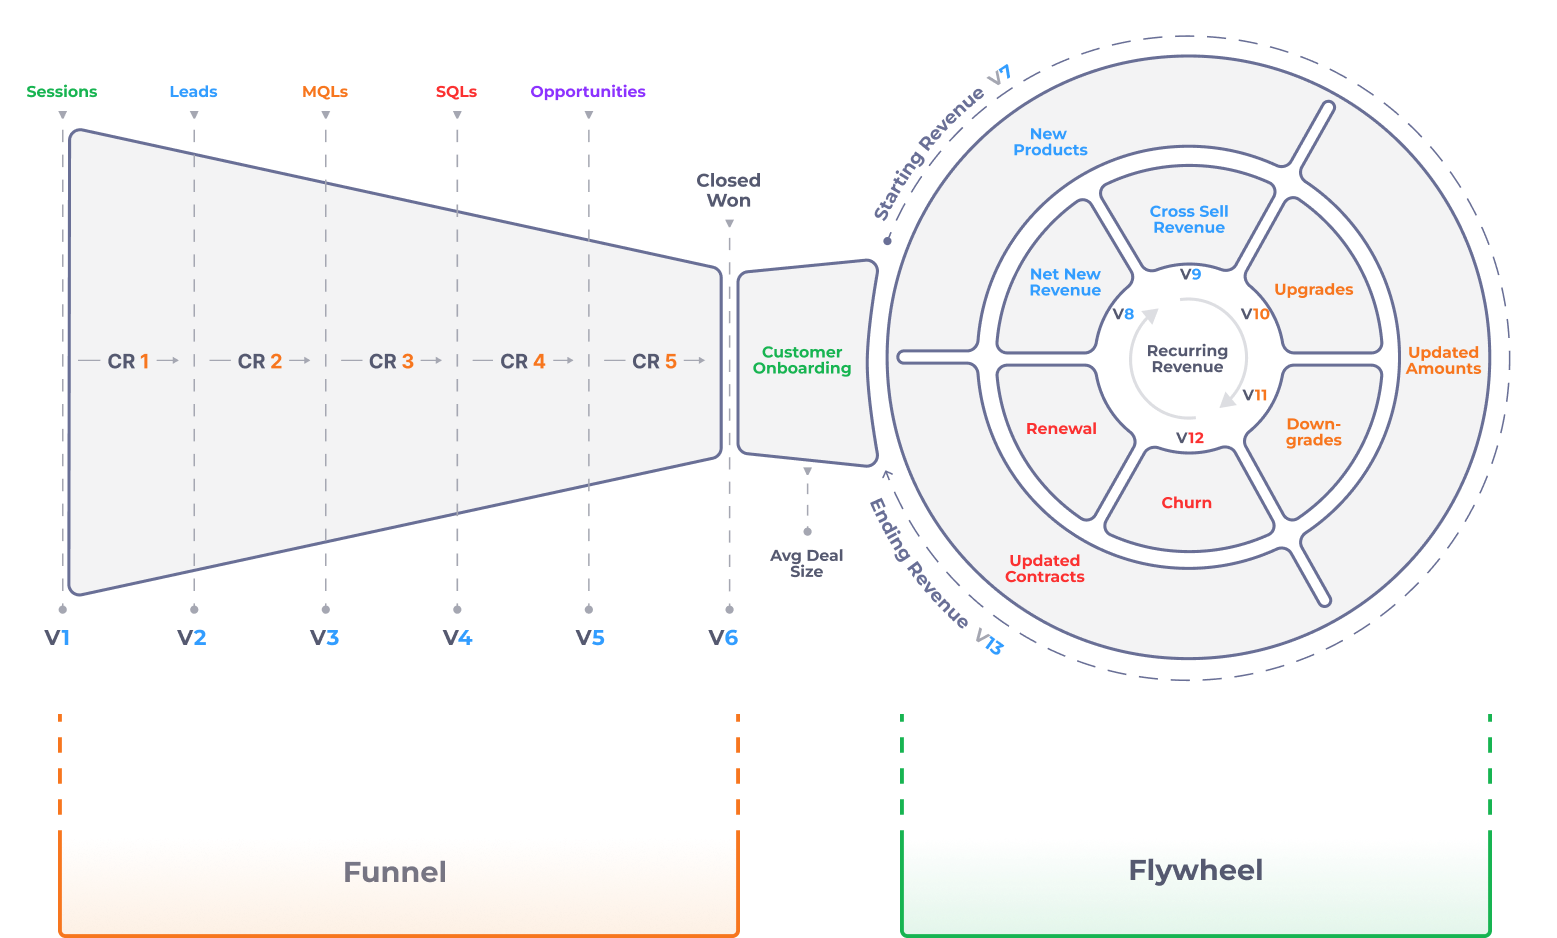
It takes traditional models a step further by bridging the gap between your acquisition Funnel and your retention Flywheel.
The Funnel
Before a dollar turns into recurring revenue, it travels through the acquisition funnel. The RPM is unique because it doesn't just collect vanity volume counts, it isolates the conversion rates between every stage to show you how efficiently your team moves buyers through the pipeline.
Secondary KPIs
When a conversion rate dips, we utilize secondary drill-downs to partition your data more specifically.
You go from knowing only that “Opportunities dropped by 15%” — to learning “Opportunities dropped by 15% specifically among West Coast reps selling Product X due to a marketing handoff error.”
Moving From Funnel To Flywheel
SaaS boards don't care about vanity metrics. They care about Net Revenue Retention (NRR), the Holy Grail of growth.
The Recurring Revenue Performance Model™ (RPM) utilizes cross-object tracking to visualize the entire lead to cash cycle so that you have action, not vanity.
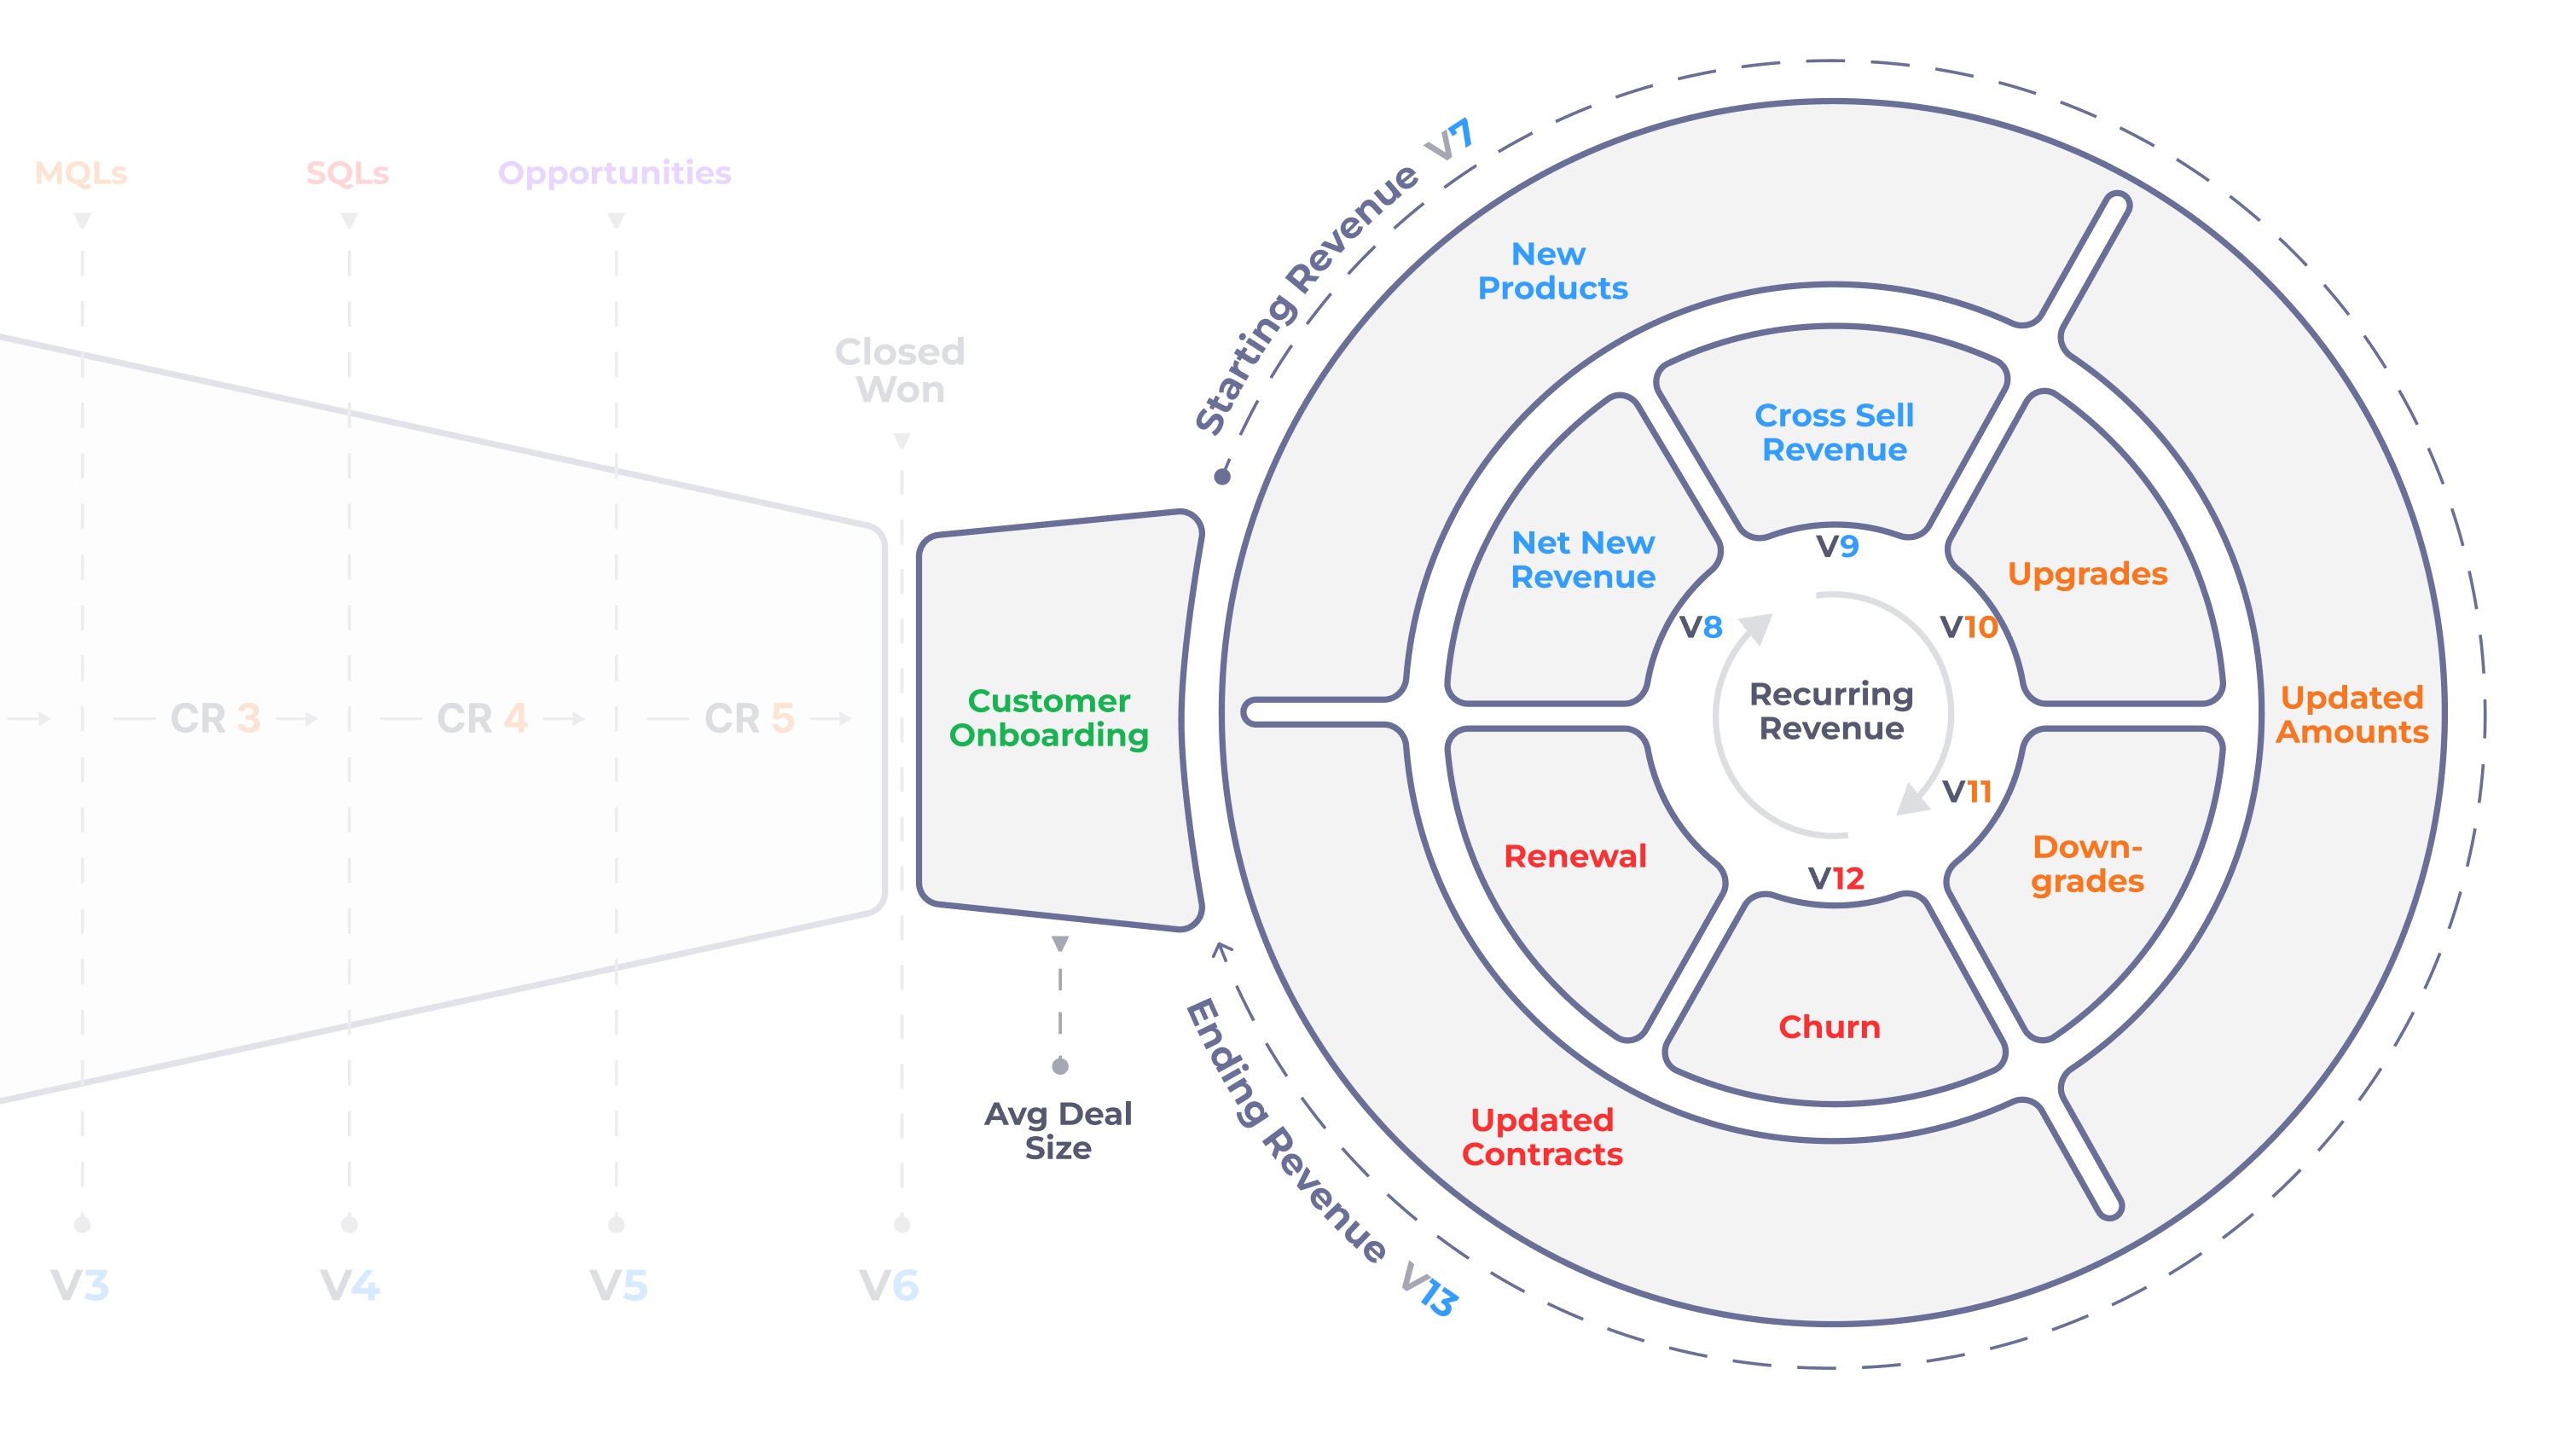
It’s a data model that doesn’t stop with the closing. It drills into the NRR formula to visualize your business not as a flat document, but as a comprehensive post-sale engine using specific, trackable metrics.
The Flywheel: Data Architecture
Standard CRMs cannot calculate true NRR out of the box because revenue crosses multiple objects over time. These codified metrics feed directly into the overarching NRR equation.
By capturing every expansion and contraction event, your team can easily calculate true Net Revenue Retention.
Turn Business Metrics Into Actionable Signals
When your data model is aligned directly to your CRM objects, you gain total operational control.
Fix Bottlenecks
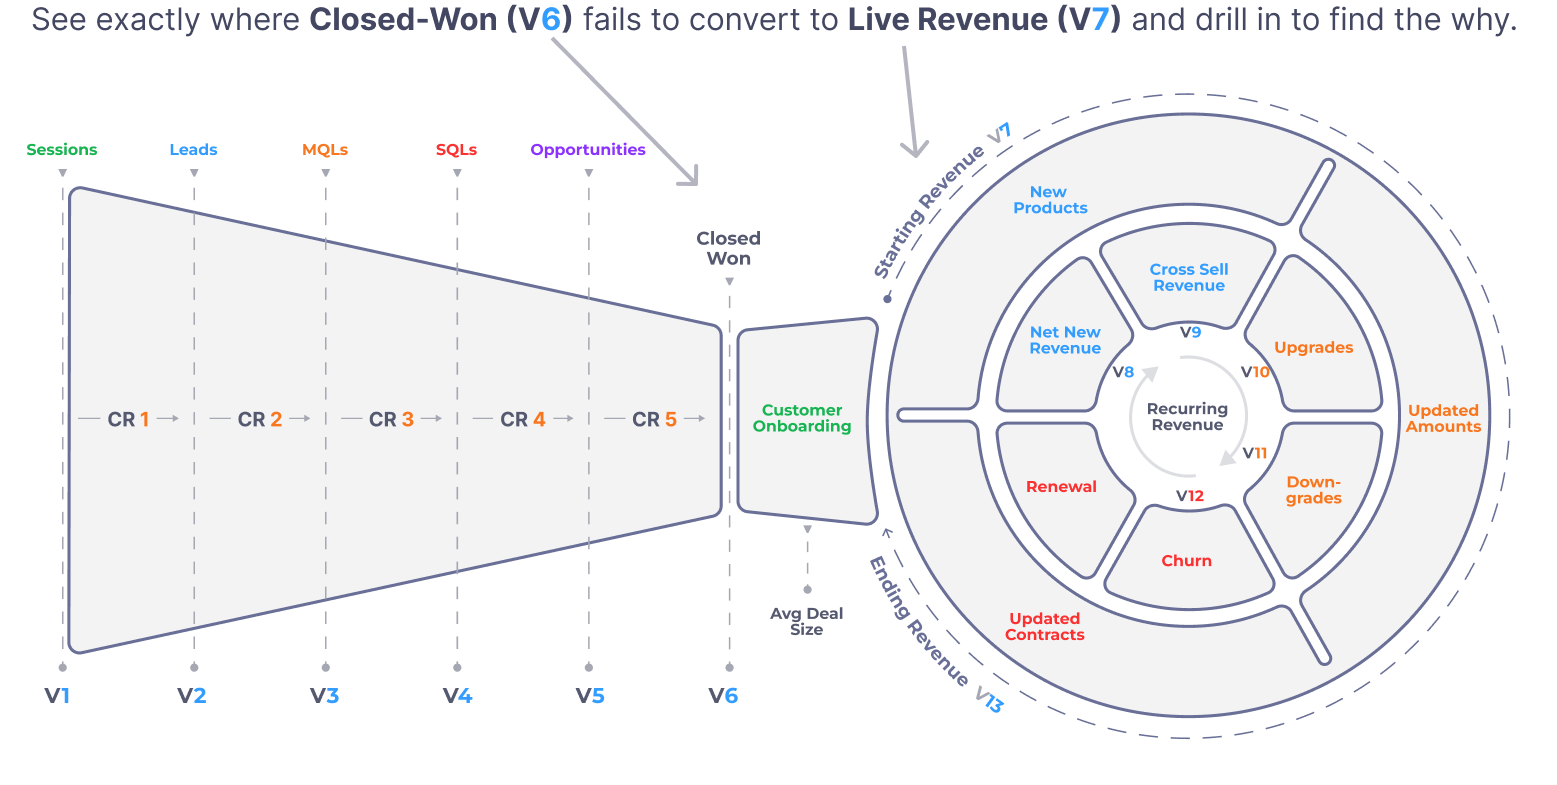
See exactly where Closed-Won (V6) fails to convert to Live Revenue (V7) and drill in to find the why.
Drill into the breakouts, like product type, business type, location, and more, to see where the friction is and how to address it. If Product 1 takes extra long to onboard, and new customers don’t send full payment until onboarding is complete, you now know what to optimize to accelerate growth.
The Final Output
Even if you have clean data that you trust as much as your own mother, and even if you are visualizing the entire revenue journey with the Recurring RPM™, sustainable growth may still be just out of reach.
Because if your leadership team is forced to dig through dozens of reports or has to wait for manual spreadsheet updates, the system is still incomplete and unsustainable.
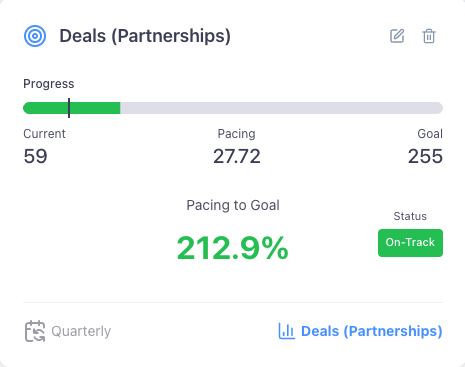
This is exactly why we built BLUF™, the reporting and activation layer that sits on top of your RPM™ data architecture to deliver real-time pacing guidance.
The Question That Matters
BLUF™ strips away the noise and answers the single most important question in business ownership in less than 3 seconds.
Rather than looking backward at quarter-end results when it’s too late to fix a miss, your reporting should be able to continuously compare your live RPM™ performance against your goals in real time.
And if it doesn’t, you’re still not getting to the heart of growth strategy.
The Era Of “Growth At All Costs” Is Over
In today's market, capital efficiency, clean data, and activation are the only metrics that protect your valuation — and your job.
Stop forcing a recurring business model into a one-time transaction reporting tool.

Revenue Engine Diagnostic (R.E.D.)
Run your own Revenue Engine Diagnostic (R.E.D.) using the definitive framework for accelerating GTM performance.
The R.E.D. is RevPartners’ proprietary system for auditing your entire lead-to-cash journey, finding hidden friction, and capturing leaked cash.
And you can now use that framework yourself with these previews of how it works as the ultimate growth system.
Physically trace the path of a dollar through your business to visualize friction, dead ends, or unfinished processes.
Watch the videoBenchmark your data to establish a baseline and align your reporting with the actual business reality.
Watch the videoTurn your diagnostic findings into a prioritized execution plan to drive measurable growth.
Watch the videoImitate every aspect of your customer’s journey by walking through your business processes firsthand.
Watch the videoReview your business goals, products, and data model metrics in one comprehensive document.
Watch the video